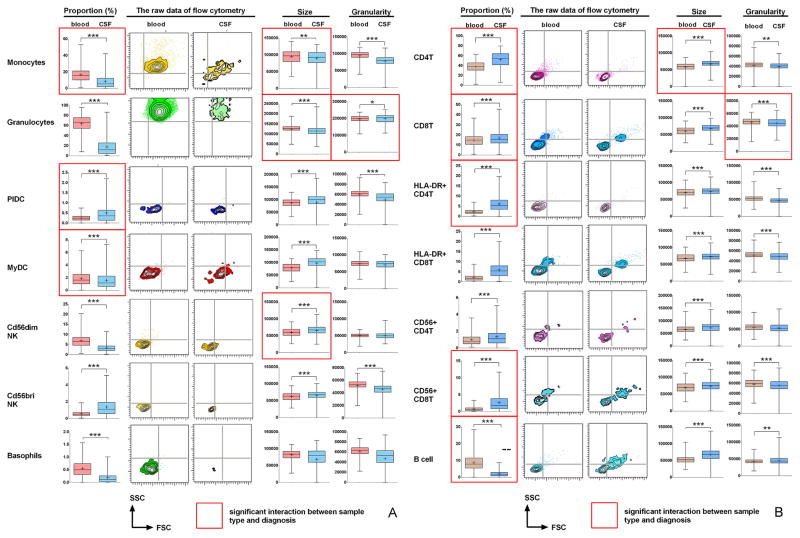
Figure 1. The differences between the blood and CSF samples in the proportion and activation status of immune cells for all patients.
(a) Differences in the cells of the innate immune system: monocytes, granulocytes, plasmacytoid DCs (PlDC), myeloid DCs (MyDC), CD56dim and CD56bright NK cells and basophils. (b) Differences in the cells belonging to adaptive immune system: CD4+ and CD8+ T cells and their subsets (HLA-DR+ effector cells and CD56+ cytotoxic cells) and CD19+ B cells. Left panels in each row demonstrate differences in the proportions of specified cell population among all CD45+ leukocytes between blood (red) and CSF (blue). Next two panels in each row show representative raw FACS images of the size (forward scatter; FSC on x axis) and granularity (side scatter; SSC on y axis) for specified cell population from MS patient. The right 2 panels in each row represent group comparisons between blood and CSF of the size and granularity for specified subpopulation of immune cells. Statistically significant differences are depicted as follows: *: P<0.05, **: 0.001<P<0.05, ***: P<0.001. Mean values are shown ± SD. Red edge highlights those markers for which statistical interaction was identified between sample type and diagnosis. For these markers the diagnosis – specific plots can be found in Supplementary Figures 2a and 2b.

