Figure 19.

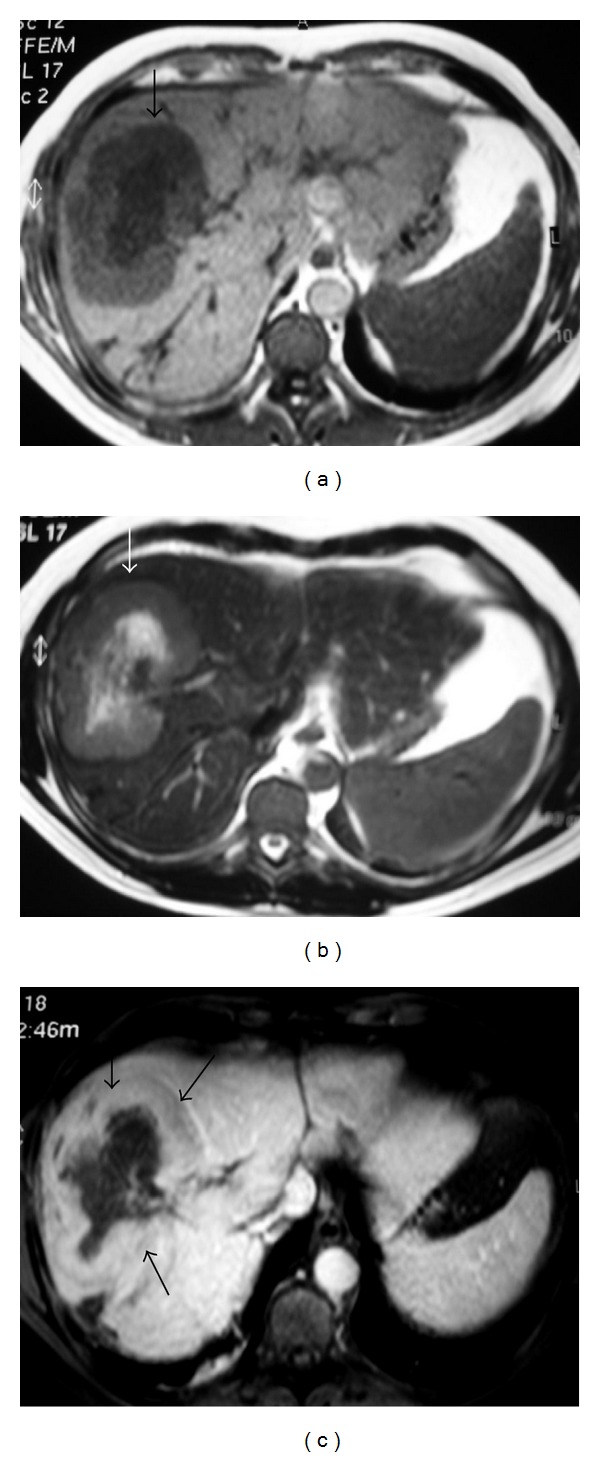
NHL. Axial liver MRI. (a) T1WI and (b) T2WI show heterogeneous mass (arrows) with central area of low signal on T1WI and high signal on T2WI (arrows). (c) The lesion shows enhancement.

NHL. Axial liver MRI. (a) T1WI and (b) T2WI show heterogeneous mass (arrows) with central area of low signal on T1WI and high signal on T2WI (arrows). (c) The lesion shows enhancement.