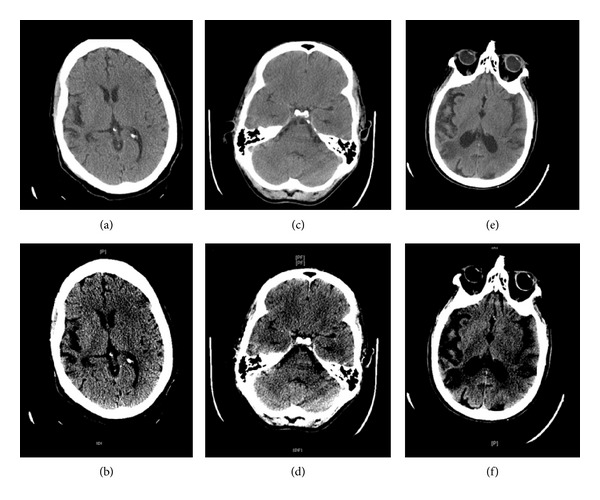
Figure 1.

Noncontrast head CTs (NCCTs). (a) NCCT of head viewed on standard windows (35/100). (b) NCCT of head viewed on Stroke Windows (35/30) demonstrating left sulcal effacement of the insular ribbon and hypodensity of left basal ganglia. (c) NCCT of head viewed on standard windows (35/100). (d) NCCT of head viewed on Stroke Windows (35/30) demonstrating right MCA sign. (e) NCCT of head viewed on standard windows (35/100). (f) NCCT of head viewed on Stroke Windows (35/30) demonstrating hypodensity of left basal ganglia.
