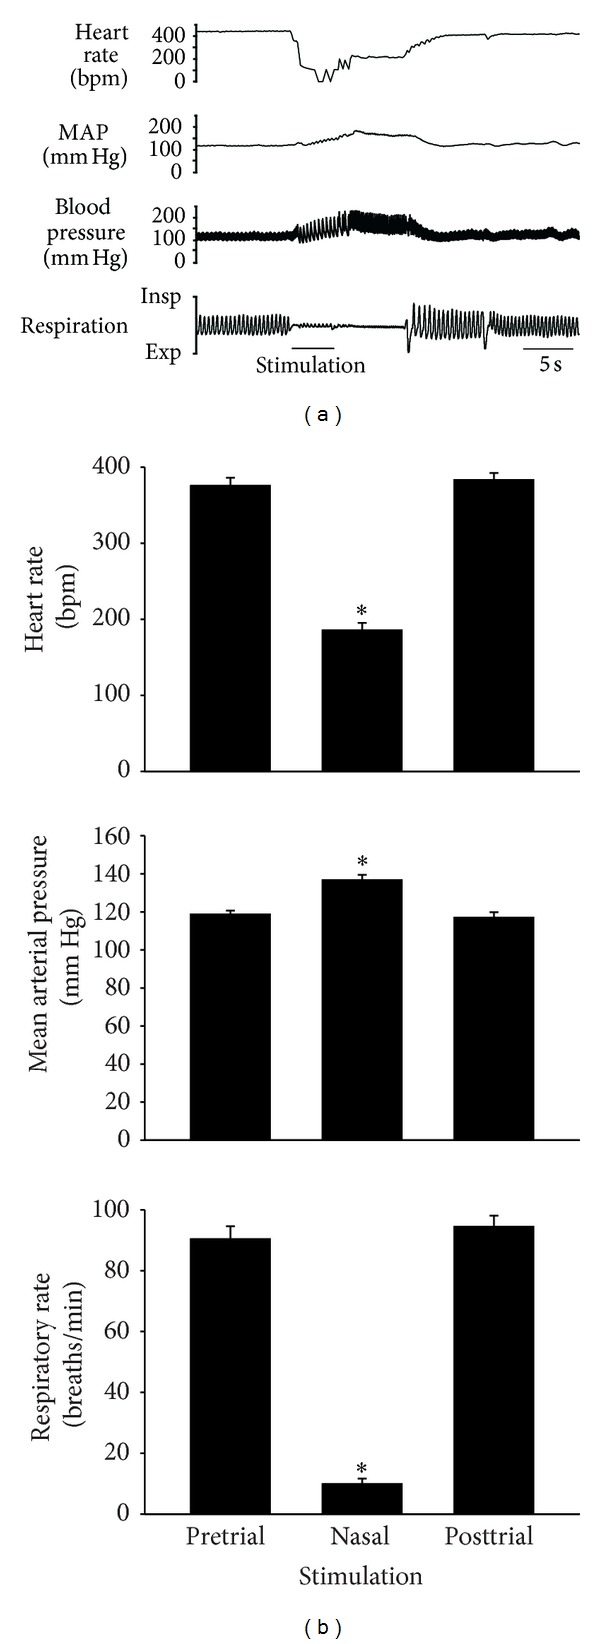
Figure 2.

(a) Original traces showing cardiorespiratory responses to stimulation of the nasal passages with ammonia vapors (bar under trace). MAP is mean arterial pressure. (b) Heart rate, mean arterial blood pressure, and respiratory rate (mean ± SE) before, during, and after nasal stimulation. *Significantly different from both pretrial and posttrial.
