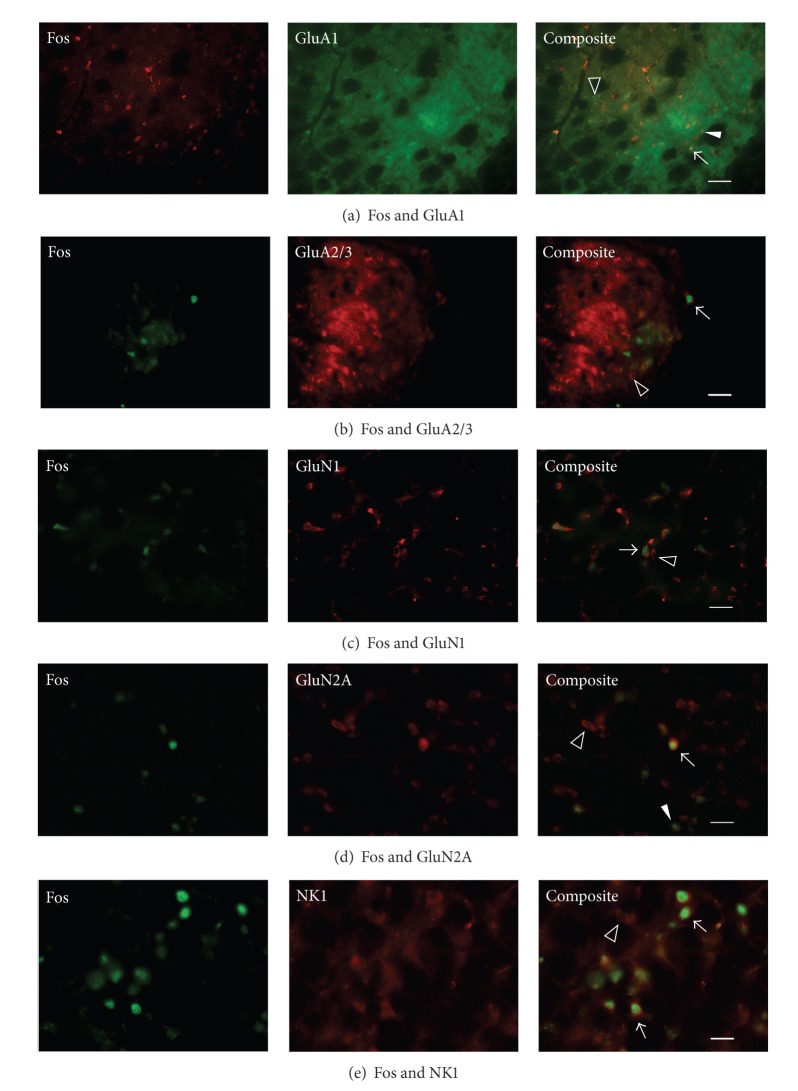
Figure 3.
Fluorescent photomicrographic images showing individual Fos (left column), neurotransmitter subunit or receptor (middle column), and composite colocalized labeling (right column). Within the superficial MDH filled triangles indicate Fos-positive neurons, open arrowheads indicate Fos-negative but subunit or receptor positive neurons, and arrows indicate Fos-positive colocalized neurons. Scale bars: (a) 50 μm, (b)–(e) 25 μm.

