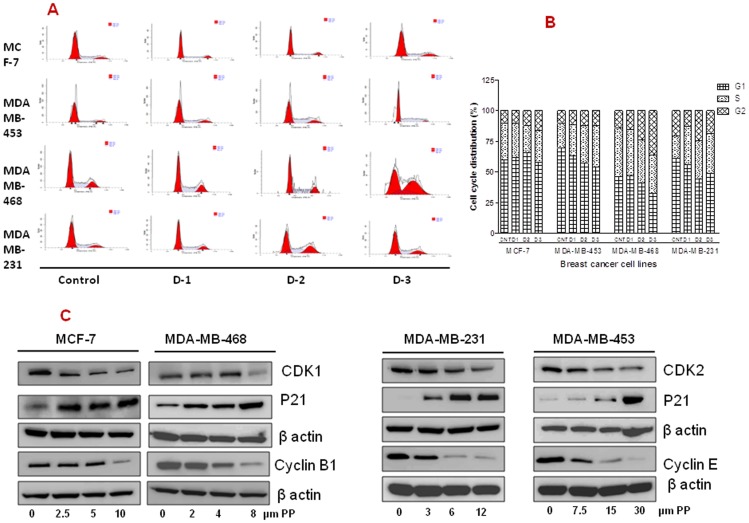
Figure 2. Effect of Panepoxydone on cell cycle phase distribution in breast cancer cells.
(A) MCF-7, MDAMB-231, MDAMB-468 and MDAMB-453 breast cancer cells (2×10⁵ cells/well) were seeded in 6 well plates, treated with PP or DMSO (0.2%, vehicle control) for 24 hrs and subsequently stained with propidium iodide (PI) followed by flow cytometry. The left triangle crest is the G1 phase, the right crest is the G2/M phase, and the middle area is the S-phase. Data are representative of one of the two independent experiments. (B) Histogram constructed on the mean value of two independent experiments. MCF-7 and MDAMB-468 cells accumulated in G2-phase whereas increase in S-phase was observed for MDAMB-231 and MDAMB-453 cells after PP treatment. (C) Total protein was isolated from control and PP-treated breast cancer cells and subjected to immunoblotting of p27, CDK1, CDK2,cyclin B and cyclin E proteins. Membranes were stripped and re-probed with anti-actin antibody to ensure equal protein loading. This data indicate the possible role of PP in inducing cell cycle arrest at G2 and S phase.

