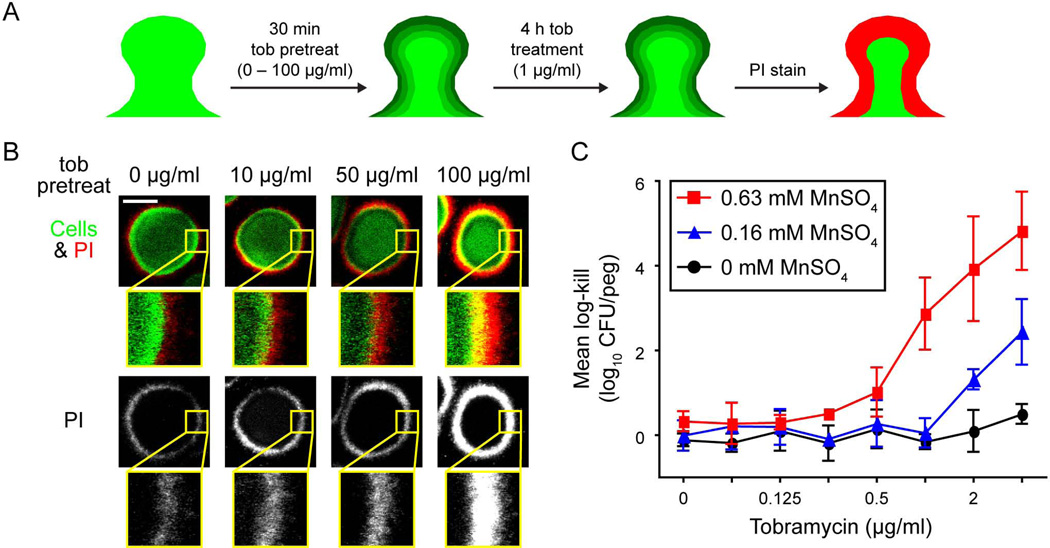
Figure 6. Limiting penetration of tobramycin protects biofilm cells.
A. Schematic of experiment. Biofilms of PAO1 were treated with 0, 10, 50, or 100 µg/ml tobramycin sulfate for 30 min followed by continuous treatment of 1 µg/ml tobramycin sulfate for 4 h. Biofilms were then stained with propidium iodide (PI) before imaging. Green shading, penetration of tobramycin due to pretreatment; red, area of cell death from 4 h tobramycin treatment. B. Representative images are shown. In the top row, the biomass is pseudo-colored green and PI, red. The bottom row is PI alone in grayscale. Underneath each cross-sectional image is a 4.25x magnified region (inset yellow box). Bar, 50 µm. C. Synergistic killing of tobramycin with MnSO4 using the MBEC assay. Biofilms were grown on polystyrene pegs and challenged with various combinations of tobramycin and MnSO4. Viable cell counts were determined by spot dilution plating. Mean log-kill was determined by subtracting the final from the initial log10-transformed cell counts. For untreated control samples, the log10-transformed mean viable cell count was 5.4 ± 0.2 CFU per peg at the end of the experiment. For clarity, only three concentrations of MnSO4 are shown. Black circles, tobramycin with 0 mM MnSO4; blue triangles, tobramycin with 0.16 mM MnSO4; and red squares, tobramycin with 0.63 mM MnSO4. Error bars represent standard deviation of results from three independent trials.

