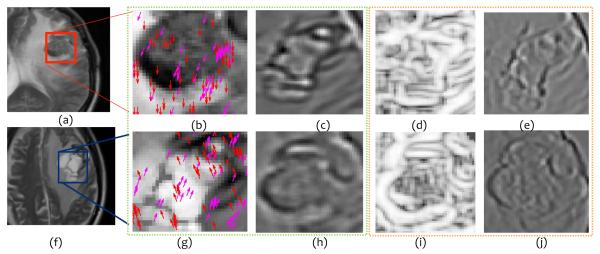
Figure 4.
Representative T1-w MR images for rBT (a) and RN (f). Figures 4 (b) , (c) and (g), (h), outlined in green, represent the top performing features (HoG (red, magenta arrows show top 2 prominent directions), and Laws E5L5 (edge and level filter) ) for rBT and RN respectively. Figures 4 (d), (e) and (i), (j), outlined in orange, represent the worst performing (W5L5 (wave and level filter in laplacian pyramid space) and W5R5 (wave and ripple filter)) features for rBT and RN respectively for MET patients.

