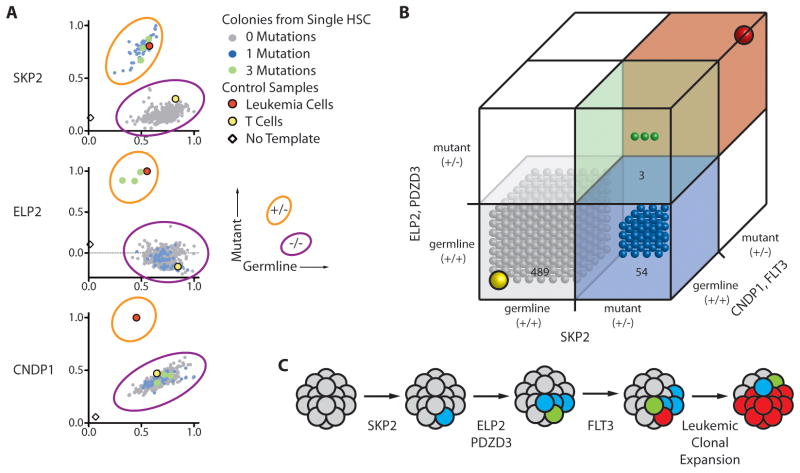
Figure 4. Single cell analysis identifies sequential mutation acquisition in pre-leukemic HSCs.
(A) The genotype of 546 myeloid colonies derived from clone sorted single residual HSCs from case SU008 were determined by multiplexed custom Taqman SNP assays for mutations identified by exome analysis to be present in each population. Selected assays are shown with the full data presented in fig. S8. Each colony is represented by a single dot in graphs for each mutation tested; colonies are colored according to genotype (see sure key). (B) 3-D plots illustrate the genotype of each colony. In both panels, the yellow dot indicates the genotype of patient T cells, and the red dot indicates the genotype of patient leukemia cells. (C) Shown is a model for the proposed clonal evolution of AML in patient SU008.

