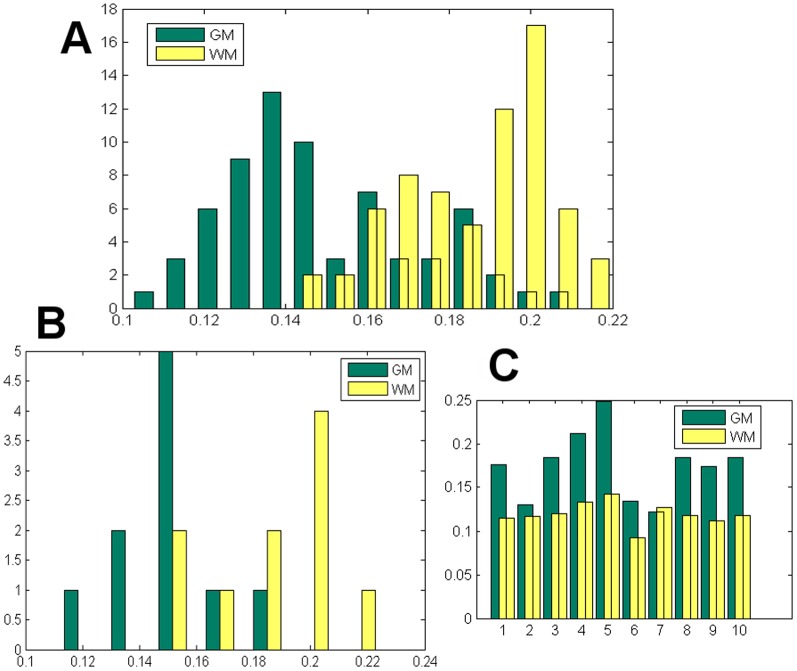
Figure 11. Histogram and COV of regional MWF, histogram averaged over all regions.
(A) Histogram of regional MWF of each ROI averaged over 10 MS subjects. MWF in WM has a higher distribution than GM, and the two are statistically well separated, with p<0.001 from a student’s t-test between the WM and GM regions (B) Histogram from different subjects of MWF averaged over all regions. A t-test between the WM and GM groups yielded p<0.001. (C) COV of regional MWF for each subject, indicating low variability in regional variations in both WM and GM.

