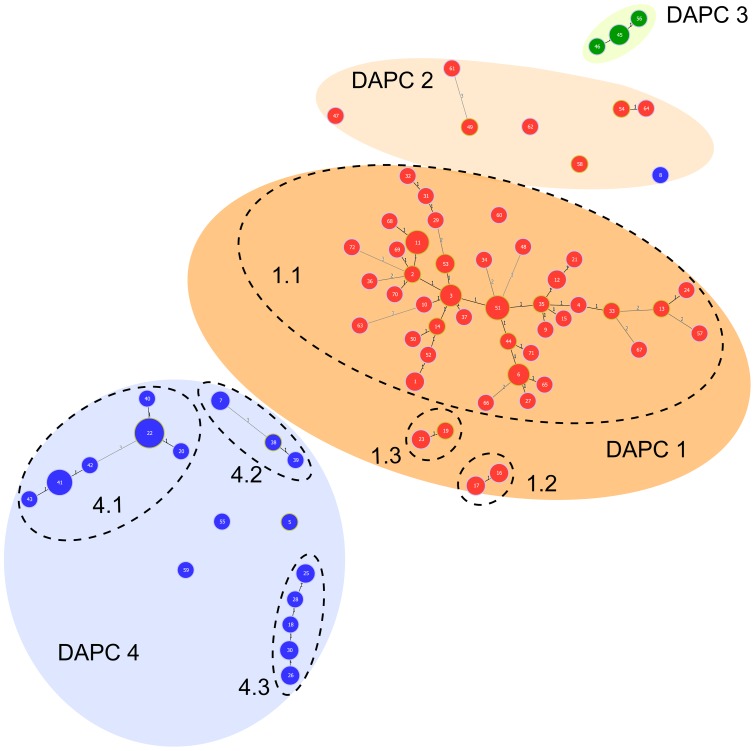
Figure 1. Categorical minimum spanning tree from MLVA-31 data (129 strains –72 haplotypes) representing the genetic diversity within a worldwide strain collection of Xanthomonas citri pv. citri in relation with its pathological diversity.
Dot diameter and color are representative of the number of strains per haplotype and pathotype, respectively (red: pathotype A; blue: pathotype A*; green: pathotype Aw). Numbers in dots are for haplotype numbers. Numbers along the links indicate the number of polymorphic TR loci distinguishing haplotypes. Haplotypes in a same colored ellipse were assigned to a same genetic cluster by Discriminant Analysis of Principal Components. Dashed ellipses indicate subclusters, as defined by goeBURST [49].

