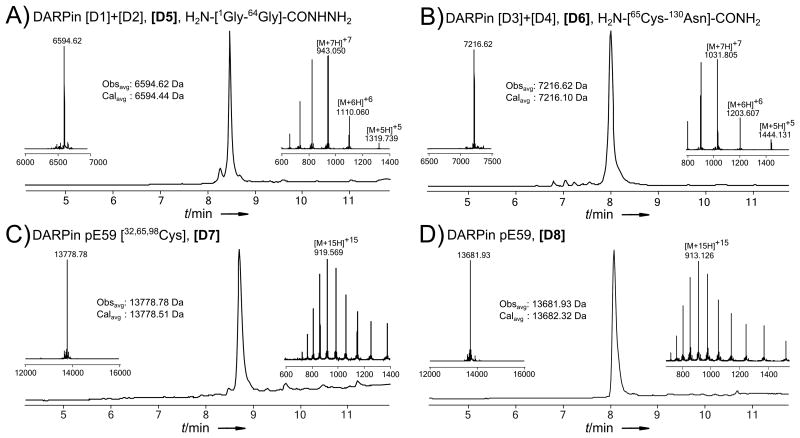
Figure 4.
LC-MS data (total ion current vs time) of purified DARPin ligation products. Each panel also displays MS insets of the major peak, comparison of average calculated and observed molecular masses for the expected product, and a deconvolution result. The charge state series on the inset mass spectra display the most abundant ions; observed and calculated masses are average. a) Purified N-terminal polypeptide H2N-[1Gly-64Gly]-CONHNH2. b) Purified C-terminal polypeptide H2N-[65Cys-130Asn]-CONH2. c) Purified full length DARPin [32,65,98Cys]. d) Purified full length, native, desulfurized DARPin pE59.

