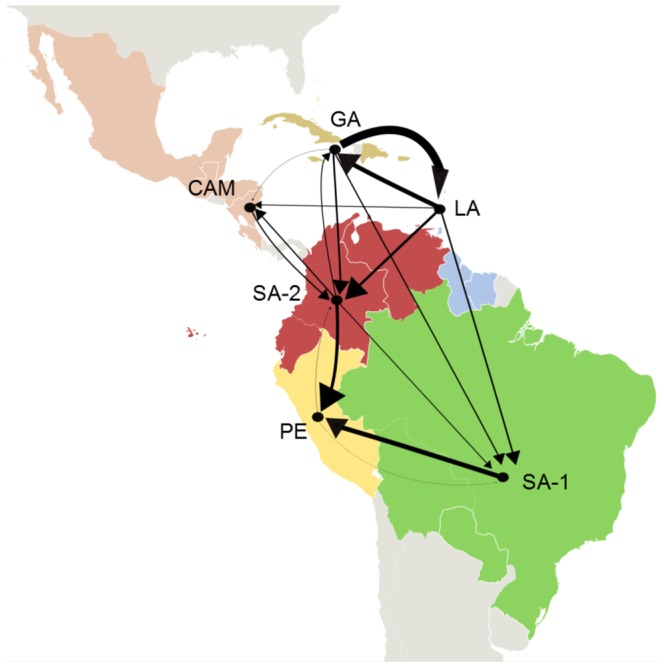
Figure 3. Major estimated viral migration rates among locations as measured using ‘Markov jump’ counts.

The width of the arrows is proportional to the viral transitions rate. Transition rates lower than 0.1 were excluded for clarity. (CAM: Central America-Mexico, GA: Greater Antilles, LA: Lesser Antilles, PE: Peru, SA-1: South America 1, SA-2: South America 2)
