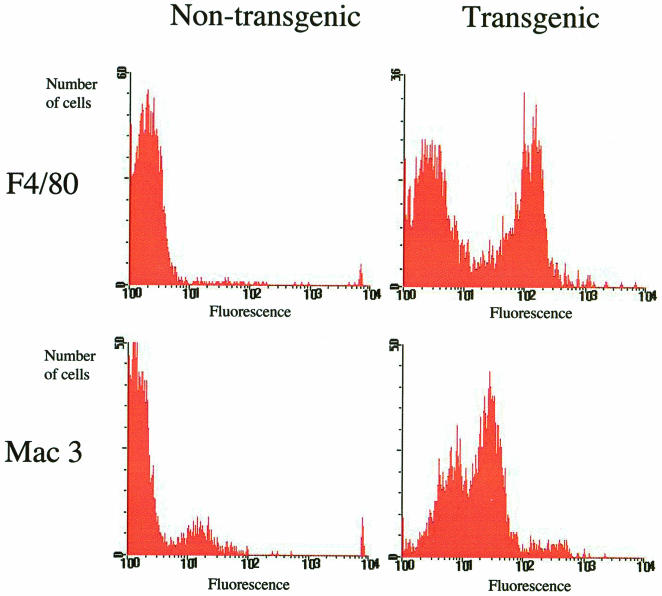
FIG. 7.
Representative FACS analyses of blood from GM-CSF transgenic and nontransgenic mice. Fluorescence graphs shown are those of monocytes/macrophages only, defined as cells falling within the region of the side-scatter-forward-scatter plot known to contain monocytes/macrophages. Fluorescence-labeled antibodies raised against the macrophage maturation marker F4/80 and the activation marker mac3 were used. An arbitrary fluorescence cutoff point of 10 was used to designate cells as either positive or negative. The percentages of positive cells were as follows: F4/80, 55% transgenic and 8% nontransgenic; and mac3, 63% transgenic and 19% nontransgenic.

