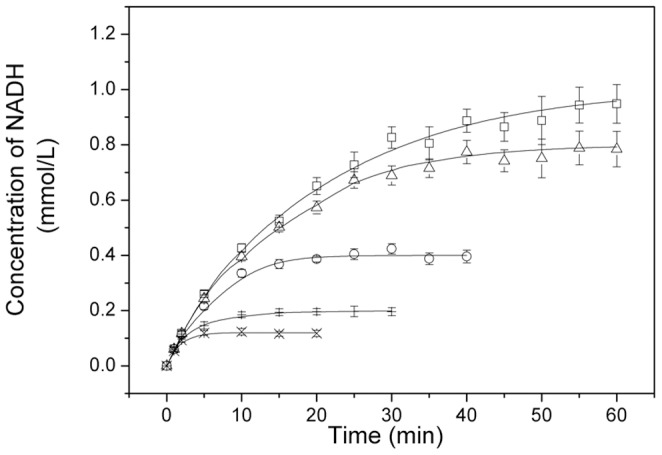
Figure 6. Comparison of the simulated values with the experimental data for GDH.

reaction conditions: NAD+ (□: 1.0 mmol/L; Δ: 0.8 mmol/L, Ο: 0.4 mmol/L, +: 0.2 mmol/L, ×: 0.12 mmol/L), simulated (lines, —); glycerol, 0.1 mol/L; GDH, 1 mg/L; pH, 12.0; temperature, 45°C.
