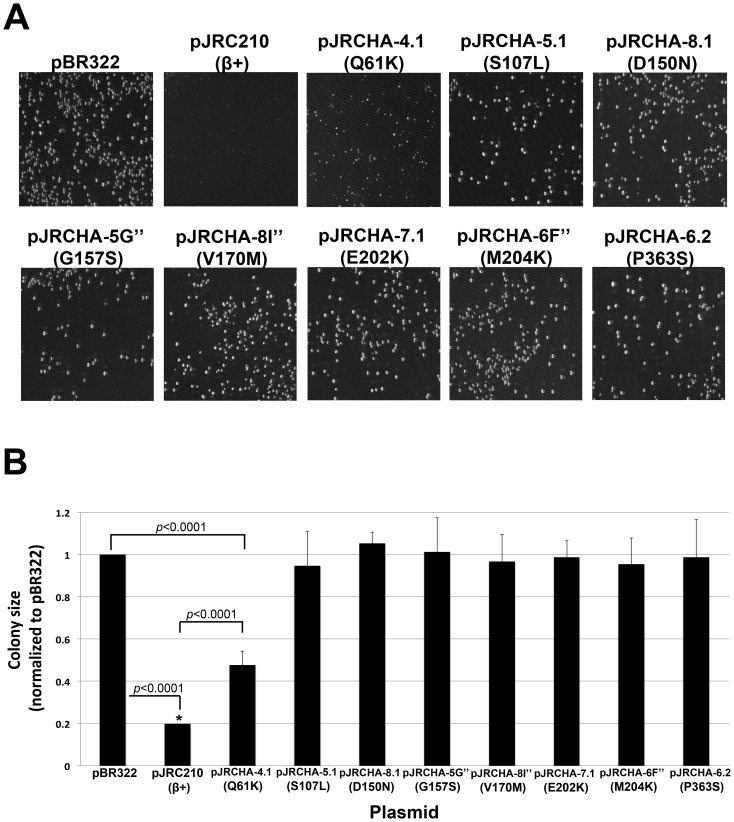
Figure 7. Effect of overexpression of different mutant clamps on growth of AB1157.
(A) Shown are representative images of LB agar plates of AB1157 transformants following 18 hrs of growth at 30°C using the indicated plasmids. (B) Colonies were measured as described in Materials and Methods, and their respective sizes are represented relative to that observed for the AB1157(pBR322) control strain, which was set equal to 1.0. The asterisk (*) indicates strains whose average colony diameter was below the measurement limit of 0.2 mm. Experiments were performed at least twice. Error bars represent one standard deviation. P-values ≤0.05 are indicated, and were calculated using the Student's t-test.

