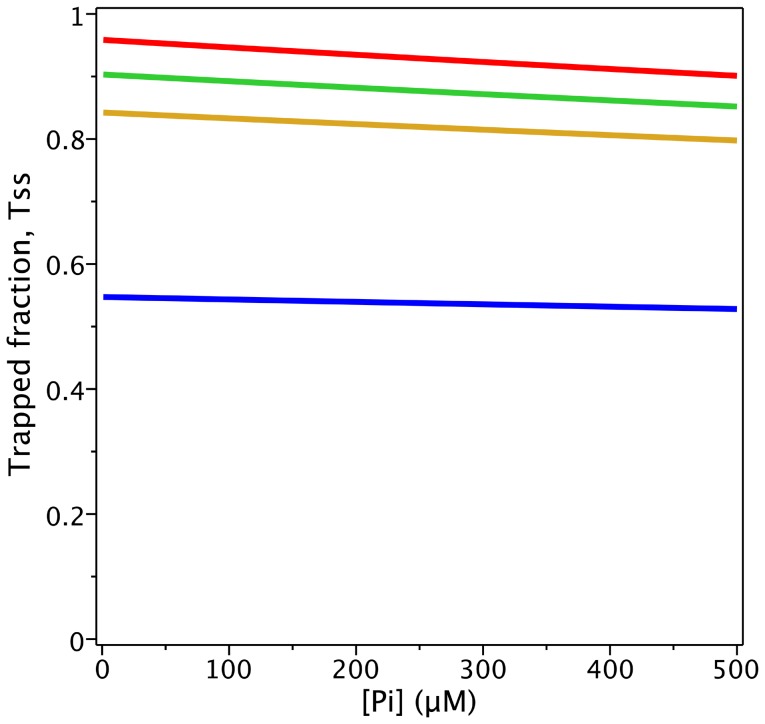
Figure 5. Protection of Pgp from Vi trapping by Pi.
Plot of the Pi concentration dependence of the trapped enzyme fraction with 100 µM Vi and different ATP concentrations, from the evaluation of  with
with  for [ATP]c = 1000 µM (red), 200 (green), 100 (yellow) and 20 µM (blue). Values of k are given in
Table 2
.

