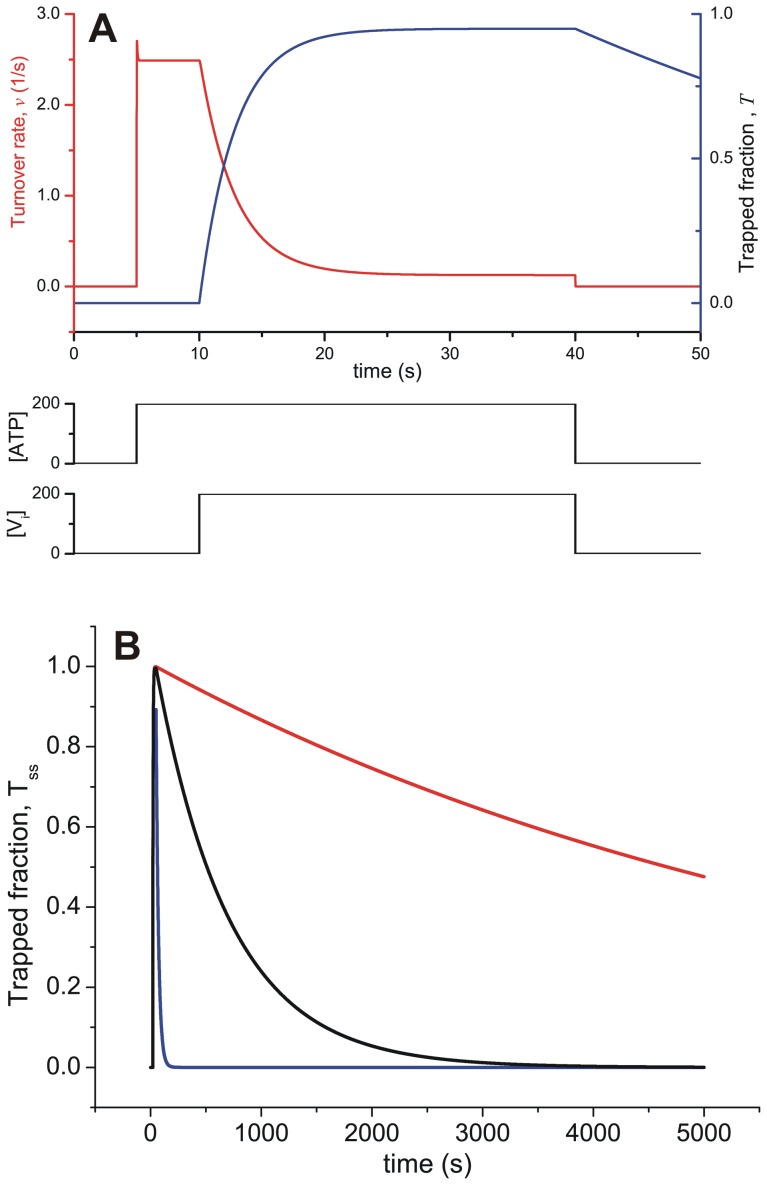
Figure 7. Time-course of ATPase activity and formation of trapped Pgp.
(A) Transient behavior of ATPase activity (red) and the fraction of trapped enzyme (blue), evaluating  with
with  at the indicated concentration pulses of ATP and Vi. (B) Time-course of the fraction of trapped Pgp according to Vi affinity. Transient behavior of the fraction of trapped enzyme on incubation with ATP and Vi, evaluating
  with
with  for pulses of 200 µM ATP and Vi of 50 s duration (not shown). Each curve corresponds to
  = 3 µM (blue), 0.1 µM (black) and 0.01 µM (red). Values of k are given in
Table 2
; [P]t = 0.25 µM.

