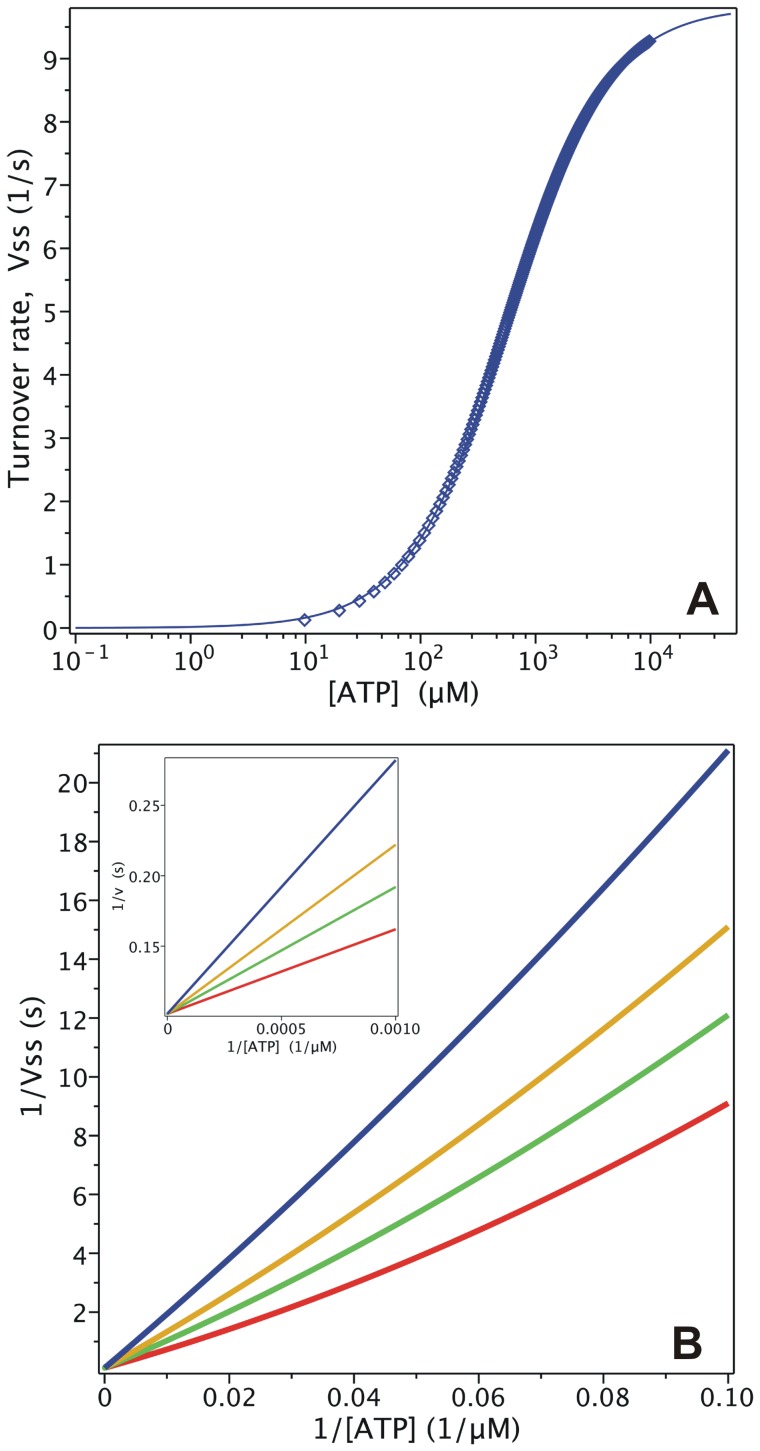
Figure 8. Steady-state simulation of the PE Alternating Cycle.
(A) ATPase activity. Semi-log plot of ATP turnover rate (symbols) from the evaluation of  with
with  . The line is the best fit to a hyperbolic equation. (B) Inhibition by ADP. Double-reciprocal plots for ATP turnover rate from the evaluation of
  with
with  for [ADP]c = 0 (red), 250 µM (green), 500 µM (yellow) and 1000 µM (blue), with ATP concentration up to 100 µM. Inset: Double-reciprocal plots with ATP concentrations ranging upwards from 100 µM. Values of k are given in
Tables 2
and
3
.

