
Figure 6.
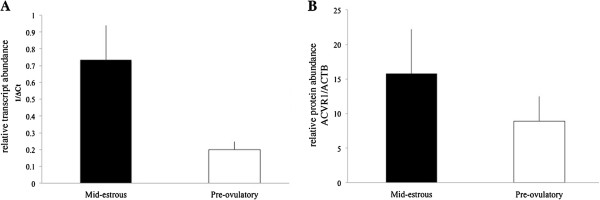
ACVR1 mRNA and protein level in exosomes. (A) Relative levels of ACVR1 in exosomes isolated from mid-estrous and pre-ovulatory follicles. Values on y-axis indicate 1/normalized (Δ) Ct values relative to geometric mean of ACTB and GAPDH. (B) ACVR1 protein level in exosomes isolated from mid-estrous and pre-ovulatory follicles.