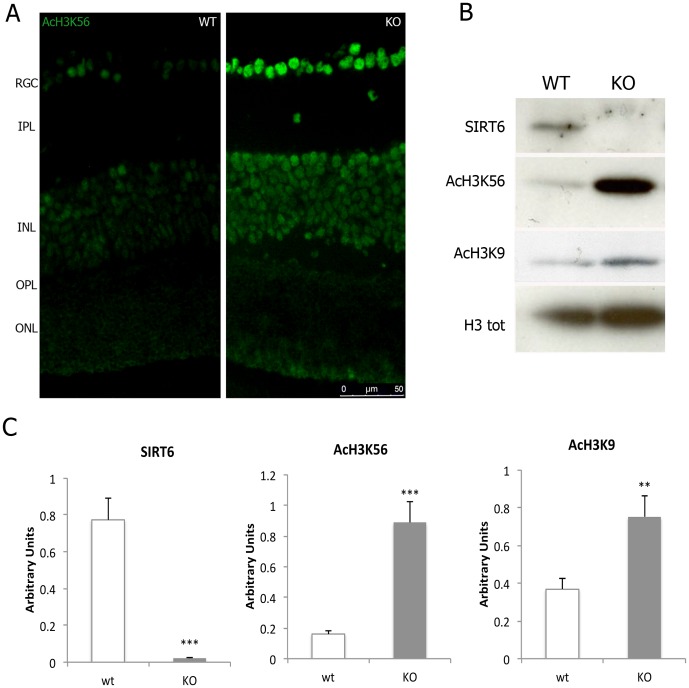
Figure 2. SIRT6 is active in the mouse retina.
a) H3K56 acetylation is shown by immunofluoescence. b) Representative Western blot showing protein levels of SIRT6 and the acetylation levels of H3K56 and H3K9 in chromatin preparations from WT and KO mice retinas. Total H3 was used for normalization. c) Quantification of the intensity of bands was determined by using the ImageJ and is represented as arbitrary units. Data are mean ± SE (n = 6 eyes/group). **p<0.01, ***p<0.001

