Figure 1.

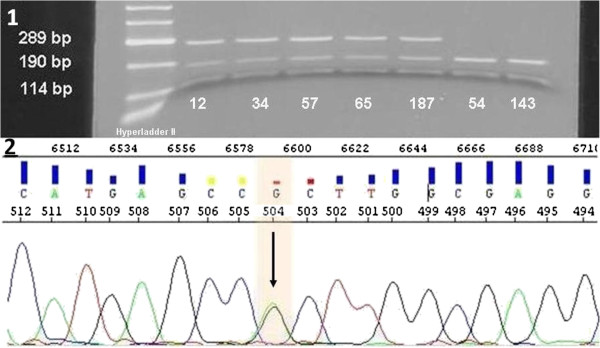
Restriction analysis of DNMT3A R882H mutations. 1) Agarose gel analysis of restricted products of 5 positive (12, 34, 57, 65, 187) and 2 negative (54, 143) patients. Wt samples showed 2 bands at 190 bp and 114 bp. Positive samples showed 3 bands at 289 bp, 190 bp, 114 bp because of the loss of a restriction site of Fnu4HI caused by the mutation. Hyperladder II (Bioline) was used as the marker. 2) Representative sequence analysis of patient 187 showing heterozygote mutation CGC to CAC.
