Figure 3.

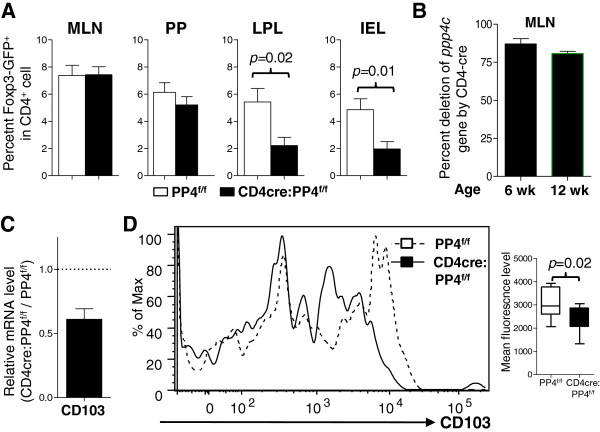
Defective gut homeostasis of Treg cells in the CD4cre:PP4f/f mice. A, MLN, Peyer’s patch (PP), LPL, and IEL cells were isolated and analyzed for the percentages of Foxp3-GFP+ cells in gated CD4 T cell populations (n = 6 ~ 16). B, MLN CD4+Foxp3-GFP+ Treg cells from MLN were MACS-purified from 6 or 12 wk old mice and analyzed for ppp4c deletion efficiency as in Figure 1G (n = 3). C, RNA from sorted LN CD4+Foxp3-GFP+ cells were analyzed as in Figure 2B. Relative CD103 mRNA levels normalized to β actin results are shown (n = 2). D, LN CD4+Foxp3-GFP+ Treg cells were analyzed as in Figure 2C. A representative CD103 plot in gated CD4+Foxp3-GFP+ population is shown (left panel). Statistical analyses of the mean fluorescence levels are also shown (right panel; n = 8 ~ 10). See Additional file 1: Figure S1 for all flow cytometry gating strategies.
