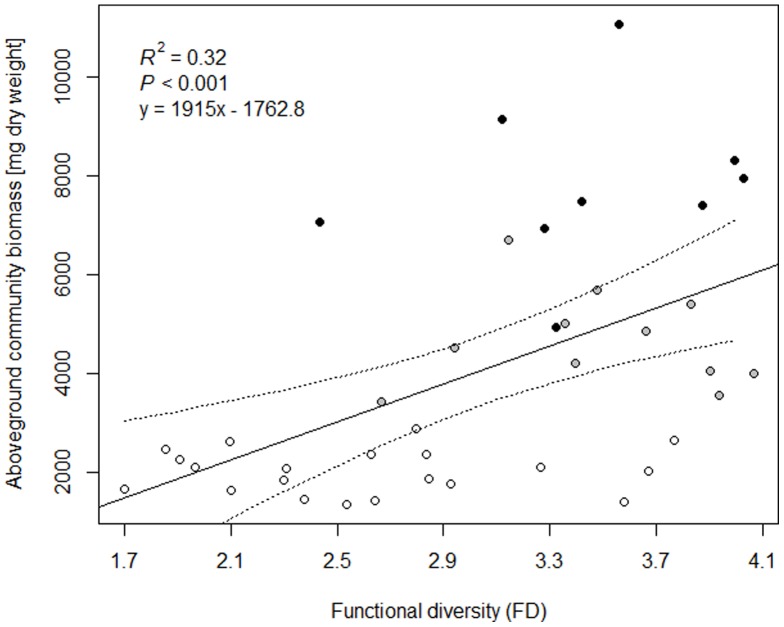
Figure 1. Aboveground community biomass plotted against the FD index of each eight-species mixture.
Increasing FD index values represent increasing functional diversity within the mixtures. (intercept = −1762.8, SE = 1577.7, t = −1.1, slope = 1915.0, 95% confidence intervals for slope 889.2–2940.9, SE = 506.8, t = 3.8, n = 40). The regression line is solid with 95% confidence bands (dashed lines). Black points represent mixtures that contained the two most productive species of the experiment (Melilotus albus and Medicago x varia). Grey points represent mixtures that contained either M. albus or M. x varia. Empty points represent mixtures that contained neither of these two species.

