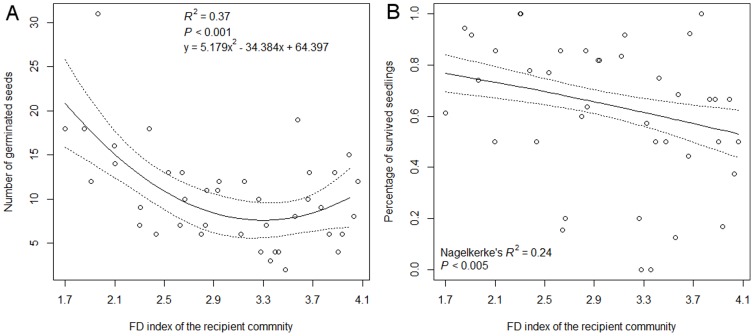
Figure 3. Invasion of S.canadensis.
(A) Number of germinated seeds of S. canadensis from 100 sown seeds in each mesocosm (linear regression, intercept = 64.4, SE = 14.4, t = 4.5, linear coefficient = −34.4, SE = 10.1, t = −3.4, quadratic coefficient = 5.2, SE = 1.7, t = 3.1, n = 40) and (B) the percentage of survived seedlings plotted against the increasing FD index (logistic regression, intercept = 1.9, SE = 0.4, z = 4.5, slope = −0.5, SE = 0.1, z = −3.2, n = 40, note that Nagelkerke's R 2 is a pseudo R 2, comparison to standard R 2 from ordinary least square regression is not appropriate). Regression lines are solid with 95% confidence bands (dashed lines).

