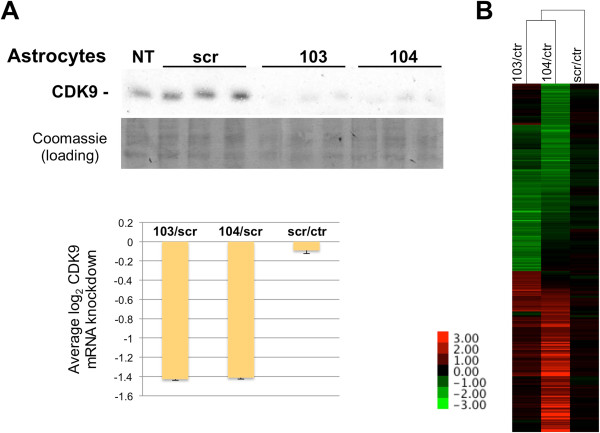
Figure 4.

Effect of CDK9 knockdown on gene expression in primary astrocytes. (A) Knockdown of CDK9 results in markedly reduced CDK9 expression (siRNA experiments were done in triplicate as shown). A representative portion of the Coomassie Blue stained PDVF membrane is shown as loading control. NT indicates untransfected cells and scr indicates scramble siRNA. (B) log2 expression ratios for transcripts which levels changed a +/-log2 ratio or more with siCDK9 after elimination of genes which expression was altered nonspecifically by transfection of scr siRNA (see text) were clustered (correlation uncentered, average linkage). Correlation distances are shown on the top dendogram. A heat map legend is shown.
