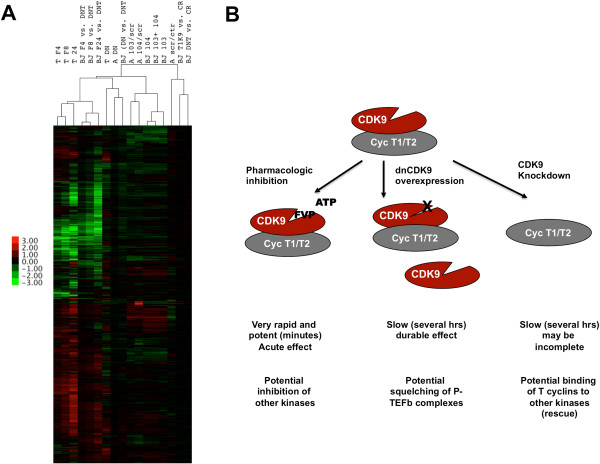
Figure 5.

Hierarchical Cluster analysis of al treatments. (A) Genes with +/-1 log2 ratios for treatments described in this study and [6] were clustered as described in the text and previous figures. Cell treatments are indicated on top. T indicates T98G cells, A indicates astrocytes, BJ indicates BJ-TERT fibroblasts. FVP treatments are indicated by F4, F8 or F24. Correlation distances are shown on the top of the arrays. A heat map legend is shown. (B) Schematic representation of the three strategies used to inhibit CDK9 activity, their mechanism, speed and potential off target effects.
