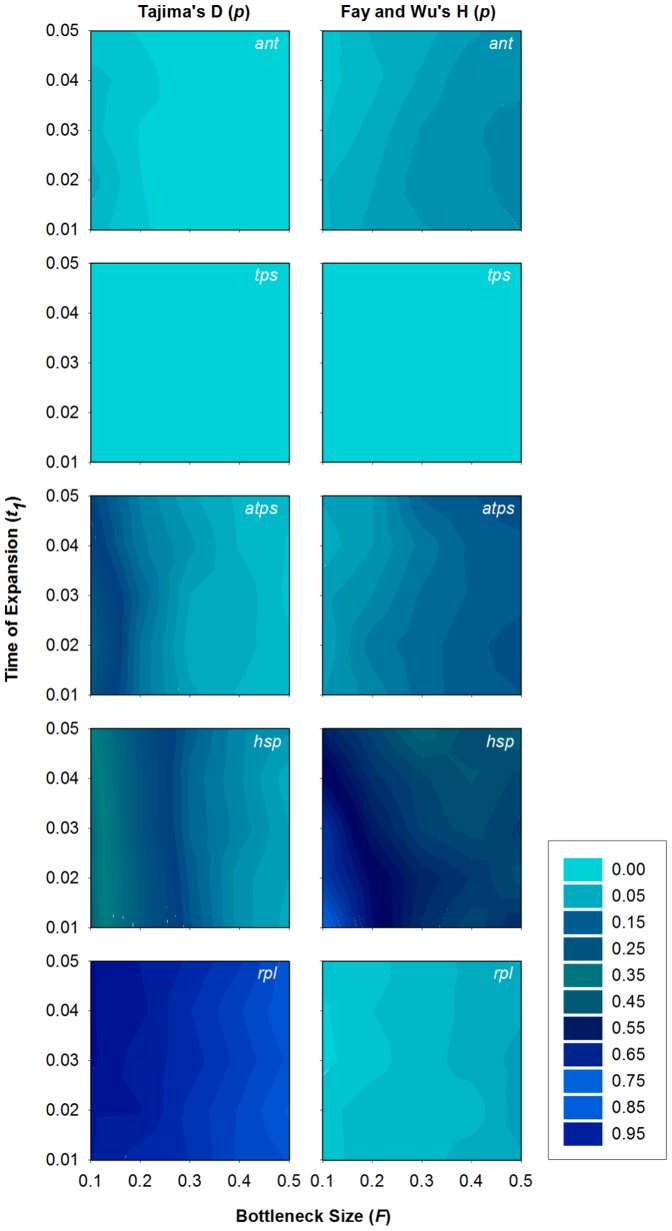
Figure 4. Results of population bottleneck simulations.
P-values for Tajima's D and Fay and Wu's H tests from coalesceant simulations of bottleneck scenarios run with a constant growth rate (α = 10) since the initial time of expansion (t 1). Bottleneck size (F) is defined as a proportion of the present day population (N e). The results of simulations with α = 50, 100, 150, and 200 show similar p-values for each locus. The demographic model is shown in Figure 1.

