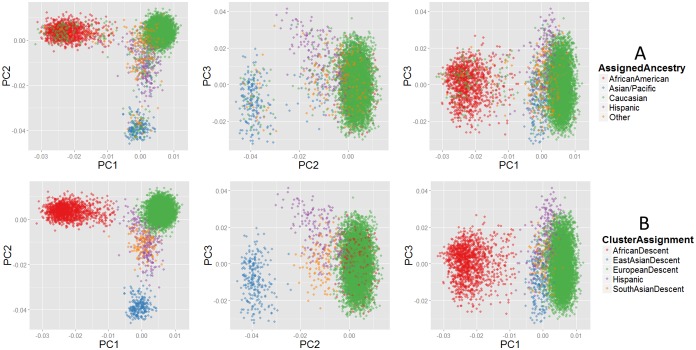
Figure 1. Comparison of administratively-assigned race and genetic ancestry, based on principal component analysis.
A) All pairwise combinations of principle components (PCs) 1 through 3, by administratively assigned race. B) All pairwise combinations of PCs 1 through 3, by cluster assignments corresponding to genetic ancestry. Comparison of Frames 1A and1B indicate individuals with administratively assigned race different than their genetically defined ancestry cluster. For example, the East Asian-descent cluster (1B; blue) contains individuals with administratively-assigned race (1A) of Caucasian (green), Hispanic (purple), and Other (orange).

