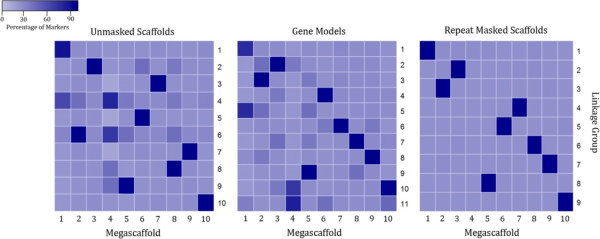
Figure 1.

Distribution of mapped markers using the unmasked, masked scaffolds and gene models a reference. The ten largest scaffolds were used as a reference for calling RADseq markers. The percentage of markers mapping to the linkage groups for each scaffold are shown, with dark blue indicating most or all markers on the scaffold map to one linkage group, and light blue indicating no or few markers map to that linkage group.
