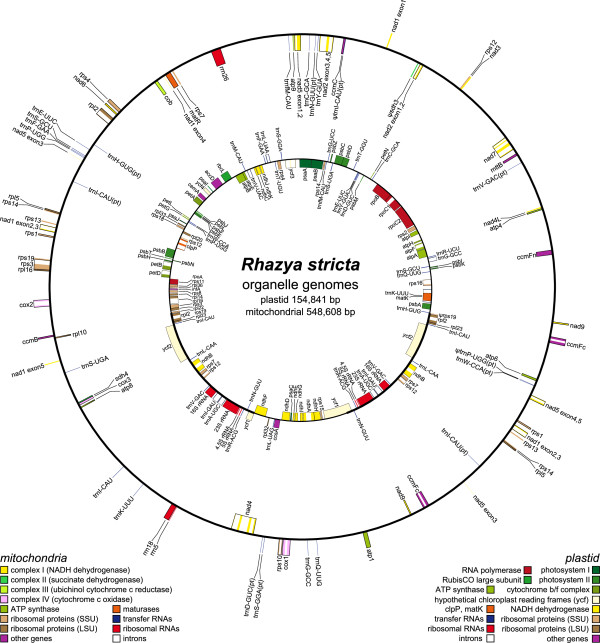
Figure 1.

Maps of the organelle genomes of Rhazya stricta. The inner and outer circles represent the plastid and mitochondrial genomes, respectively. Genes on the inside and outside of each map are transcribed clockwise and counterclockwise direction, respectively. The thick lines on the plastid map indicate the inverted repeats (IRa and IRb), which separate the genome into large and small singles copy region. Ψ denotes a pseudogene.
