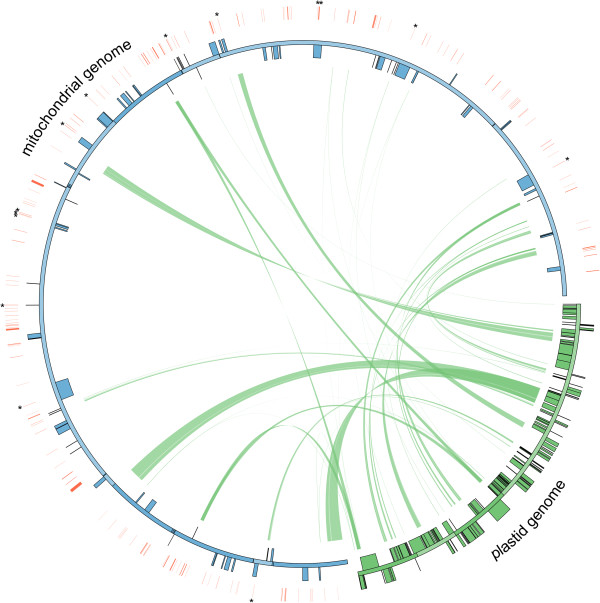
Figure 2.

Schematic representation of transfers of plastid DNA and transposable elements into the mitochondrial genome of Rhazya stricta. Each green line within the circle shows the regions of the plastid genome that have been inserted into different locations of the mitochondrial genome. Red lines outside of the mitochondrial genome indicate the location of integrated transposable elements (TEs) and asterisks indicate TEs that have inserted into genic regions. Genes indicated as blue and green boxes on the inside and outside of maps are transcribed clockwise and counterclockwise direction, respectively.
