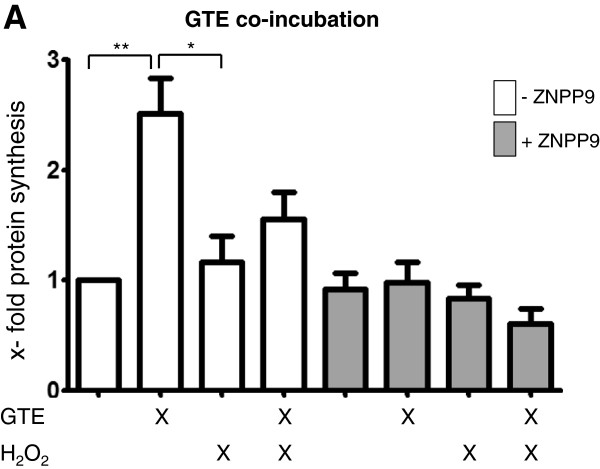
Figure 6.

Functional analysis of GTE on the HO-1 pathway. Osteoblasts were stimulated for 0.5 h with 200 μg/ml GTE combined with 1 μM H2O2 and/or 25 μM ZNPP9. As controls served unstimulated cells (N = 3, n = 1). Bars represent mean ± s.e.m, *p < 0.05, (ANOVA/Bonferroni).
