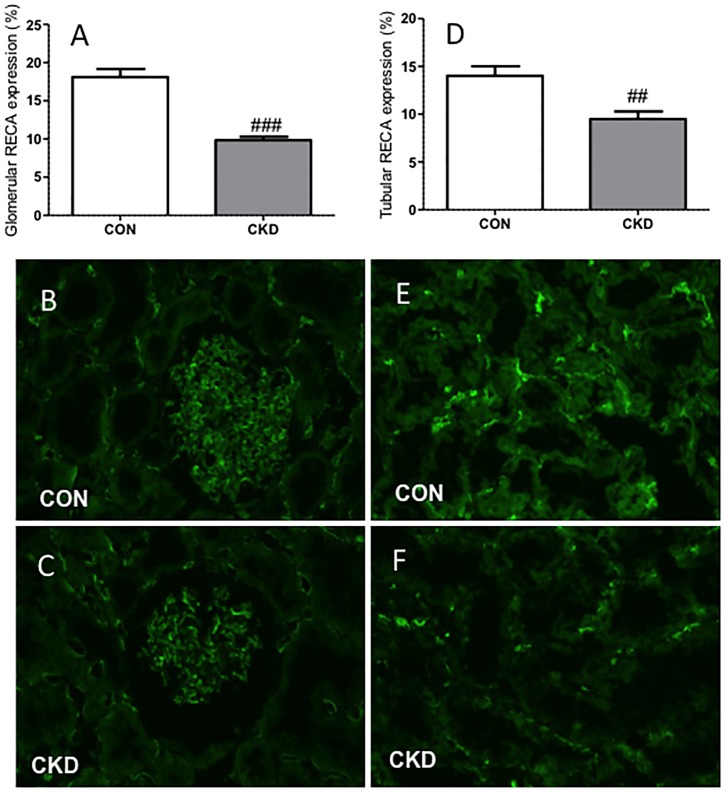
Figure 3. Less (RECA)+ pixels (green) were found in CKD rats compared to CON rats in both glomeruli (panel A) and tubular fields (panel D).
Immunohistochemical labeling is shown in CON rats (panels B and E) and in CKD rats (panels C and F). Means ± SEM. Unpaired t-test: ###P<0.001; ##P<0.01 vs. CON.

