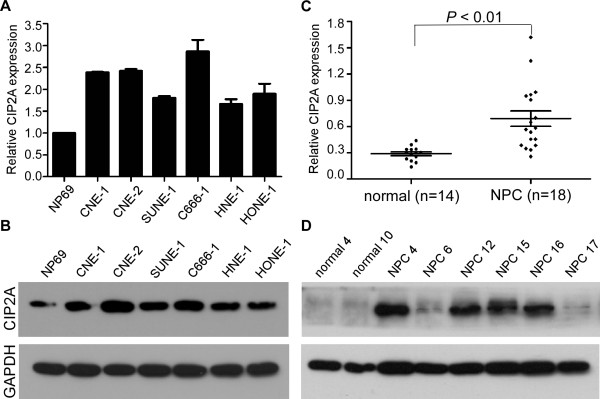
Figure 1.

Expression levels of CIP2A in NPC cell lines and clinical samples. (A-B) Expression levels of CIP2A mRNA (A) and protein (B) in NP69 and NPC cell lines. (C-D) Expression levels of CIP2A mRNA (C) and protein (D) in NPC tissues and normal nasopharyngeal epithelial tissues. GAPDH was used as the endogenous control. Data are presented as the mean ± SD, and P values were calculated with Student’s t-test.
