Figure 2.

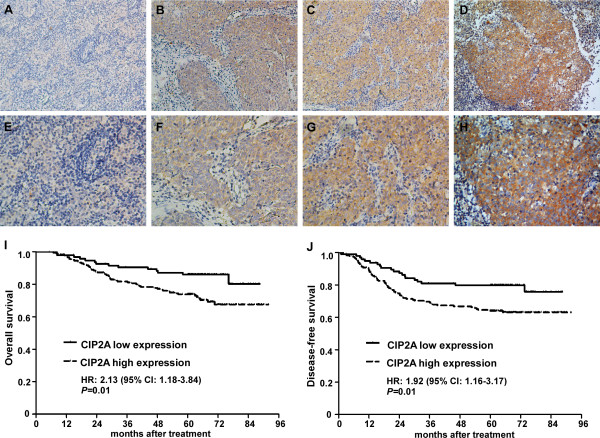
Expression levels of CIP2A and survival of NPC patients. (A-H) Dicer1 protein expression is mainly localized to the cytoplasm. (A, E) Negative staining (A: 200×; E: 400×); (B, F) Weak staining: light yellow (B: 200×; F: 400×); (C, G) Moderate staining: yellow brown (C: 200×; G: 400×). (D, H) Strong staining: brown (D: 200×; H: 400×). (I-J) Patients with high CIP2A expression had poorer overall survival (I) and poorer disease-free survival (J) rates than patients with low CIP2A expression.
