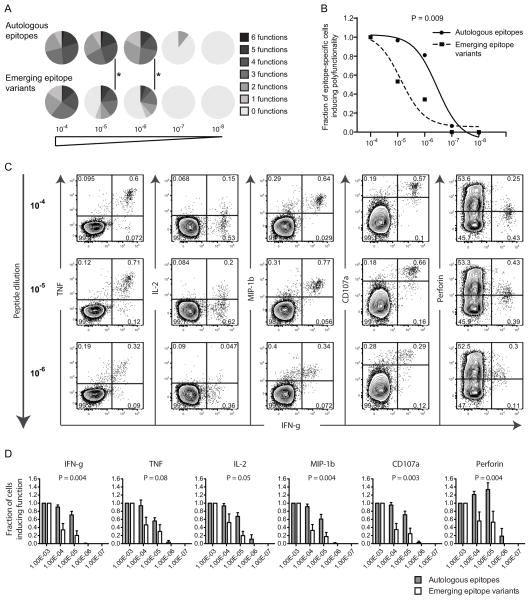
Fig. 4. Different polyfunctional sensitivity between autologous and emerging epitope variant-specific responses.
A) The number of functions (0–6) where calculated based on combined IFN-γ, TNF, IL-2, MIP-1β CD107a and perforin production and illustrated using pie charts for the different peptide concentrations (10−4–10−8). P-values < 0.05 are depicted with * (permutation test). B) The polyfunctional sensitivity was compared between autologous and emerging epitope variant-specific responses at 5 different peptide concentrations. The Y-axis depicts the fraction of polyfunctionality (number of functions) from the first peptide concentration (1 ug/mL) and subsequent peptide concentrations. The sigmoidal curves are illustrated for autologous (solid line) and emerging epitope variants (dashed line) where the symbols illustrate the average number of functions in each group at different peptide concentrations. The p-values were calculated based on the area-under-curve for each epitope-specific response and then compared between the groups using paired t-tests. C) FACS plots of a representable example of an autologous epitope-specific response. IFN-γ production in combination with the other functional markers is depicted for those different peptide concentrations generating a positive response. D) Bar plots showing the fraction of all functions from baseline (1 ug/mL) and subsequent peptide concentrations. The bars illustrate the mean (and SEM) fraction of the response for autologous (grey bars) and emerging epitope variants (white bars), where the p-values were obtained using area-under-curve calculations for each epitope-specific response and then compared using paired t-tests.

