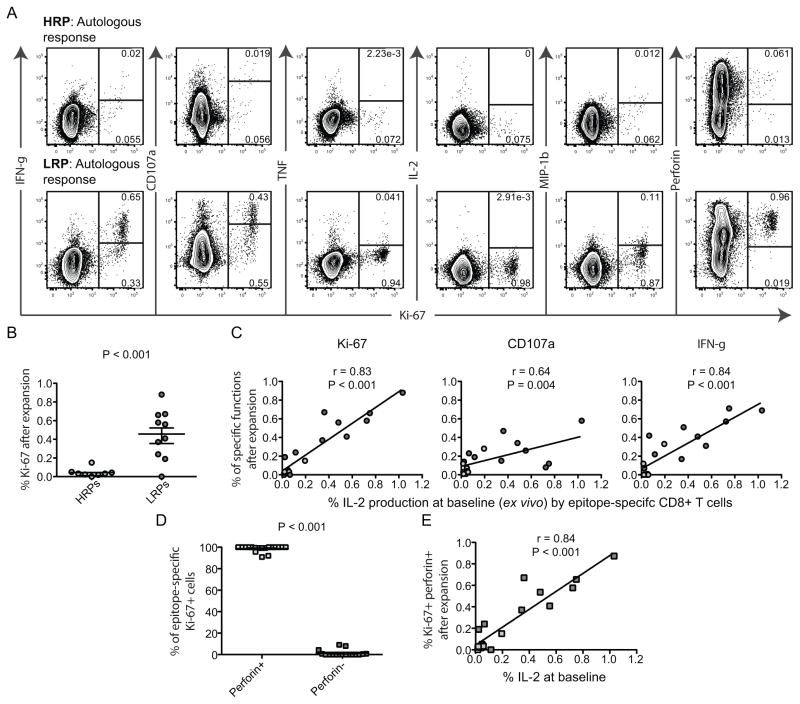
Fig. 6. LRPs show profound up-regulation of Ki-67 and perforin after 3-day stimulations with autologous and emerging epitope variants.
A) FACS plots illustrating the expression of Ki-67 (X-axis) together with the other functional markers (Y-axis) after autologous peptide stimulations for 3 days. The upper row shows a representative autologous-specific response in a HRP, and the lower a LRP response. B) Scatter plot demonstrating the Ki-67 up-regulation of total CD8+ T cells for HRPs and LRPs after autologous and emerging epitope variant stimulations. P-values were obtained from un-paired t-tests and mean (SEM) are depicted in the plot. C) Correlation between the baseline (6 hr stimulation) magnitudes of IL-2 producing CD8+ T cells (X-axis) and Ki-67, CD107a and IFN-γ expression after 3 days in culture (Y-axis) with autologous and emerging epitope variants. The darker grey circles represent LRPs and the lighter grey circles HRPs. All correlations were based on Spearman non-parametric test. D) Graph demonstrating the % of Ki-67+ CD8+ T cells (3 days incubation) that up-regulate perforin or not (paired t-test). E) Spearman correlation analysis of baseline IL-2 production by CD8+ T cells (X-axis) and Ki-67+perforin+ expression (Y-axis) after 3 days in culture with epitopes.

