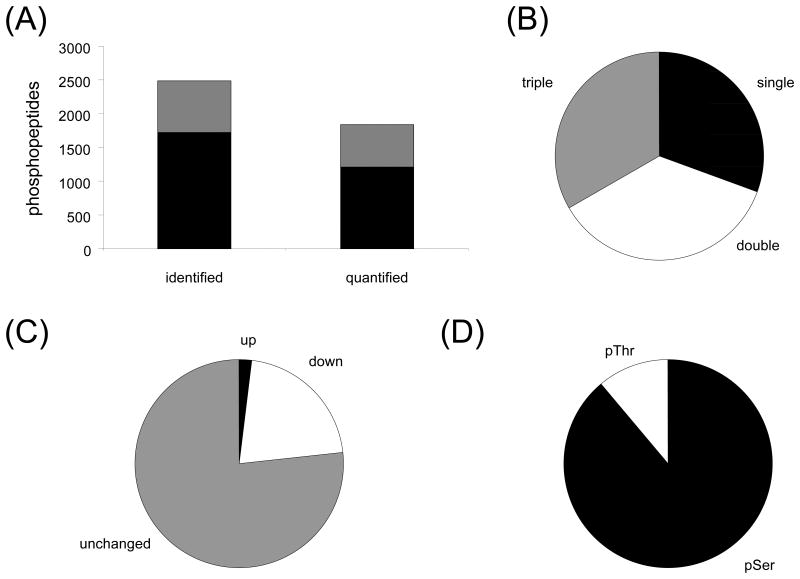
Figure 3.
Analysis of phosphopeptides quantified following MMS treatment at the S-phase time point. (A) Number of phosphopeptides identified or quantified by a single measurement (black) and by two or more measurements (gray) in total cell lysate. (B) Phosphorylation state distribution of identified phosphopeptides following MMS treatment in total cell lysate, showing percentage of singly phosphorylated peptides (black), doubly phosphorylated peptides (gray) and triply phosphorylated peptides (white). (C) Distribution of phosphopeptides quantification following MMS treatment in total cell lysate, showing percentage of proteins increased 2-fold or greater (black), proteins decreased 2-fold or greater (white) and proteins whose levels were unchanged (gray). (D) Phosphoamino acid distribution of quantified phosphopeptides with confident site localization (AScore greater or equal to 13) following MMS treatment in total cell lysate, showing percentage of phosphoserine (black) and phosphothreonine (white).

