Figure 4.

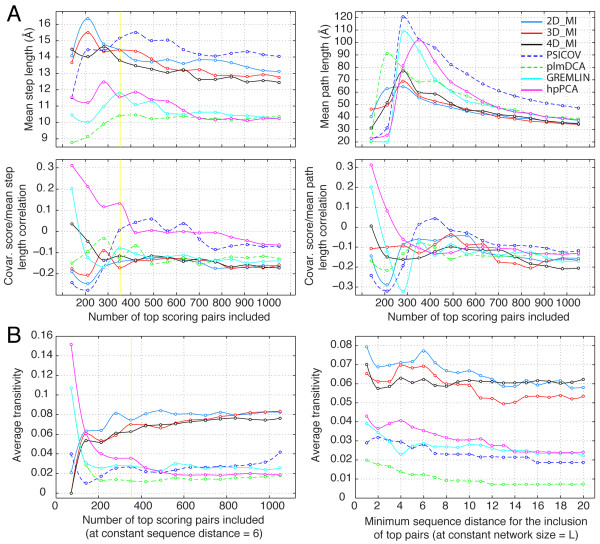
Dependence of covariation scores on connectivity: MDH protein family. A. Dependence of covariation scores on path length. Top left. Mean length of the steps in each path connecting pairs within scoring threshold; the threshold is progressively moved to include a number of pairs equal to 3 L. A vertical yellow line marks a number of pairs equal to L. Top right. Mean length of the path connecting pairs within scoring threshold. As more pairs are included in the analysis the probability of finding a shorter path increases and all traces converge to a smaller path length. Bottom panels. Correlation between the covariation score and the mean step length (left panel) or the total length (right panel) of the path that connect the two members of each pairs through residues that belong to other pairs. B. Dependence of covariation scores on transitivity. Left panel. The size of the covariation graph is varied by including a progressively larger number of top scoring pairs at constant minimum sequence distance = 6. A vertical yellow line marks a number of pairs equal to L. Right panel. The minimum sequence distance is varied at constant graph size = L.
