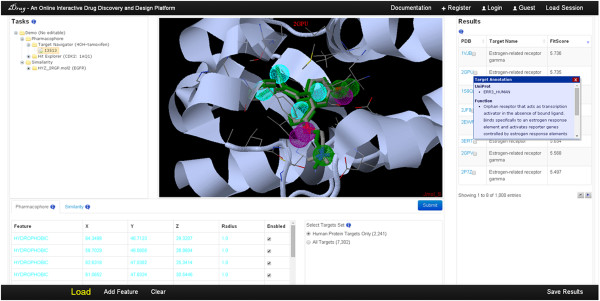
Figure 2.

The iDrug interface. The task management is in the upper left and provides easy access to the full set of the history work. The Jmol-based molecular viewer is in the middle and displays the query molecule and results structure. The query editor is shown in the bottom and supports the interactive modification of the parameters based on the properties of the computational software. The results browser is on the right and displays the complete results along with the available details. In this figure, potential targets of tamoxifen obtained from iDrug are shown as well as the target pharmacophore model. On mouse over, a preview of the annotation information is displayed in a pop-up window, as shown for 2GPU in this example.
