
Figure 5.
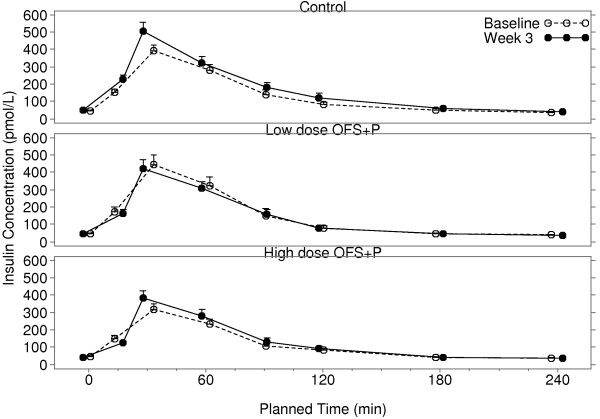
Mean insulin concentrations fasting and over 4 h post-prandial at baseline and after 3 weeks of treatment. Error bars represent the mean + SEM. OFS, oligofructose; P, apple pectin.
Official websites use .gov
A
.gov website belongs to an official
government organization in the United States.
Secure .gov websites use HTTPS
A lock (
) or https:// means you've safely
connected to the .gov website. Share sensitive
information only on official, secure websites.
Mean insulin concentrations fasting and over 4 h post-prandial at baseline and after 3 weeks of treatment. Error bars represent the mean + SEM. OFS, oligofructose; P, apple pectin.