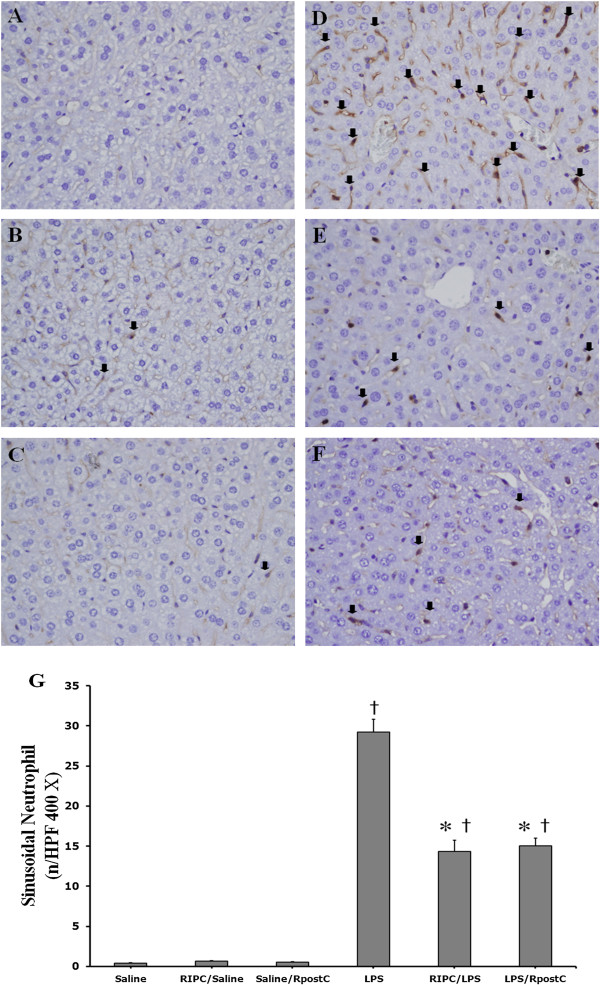
Figure 6.

Liver histopathological changes. (A) Saline group (B) RIPC/Saline (C) Saline/RpostC group (D) LPS group (E) RIPC/LPS group (F) LPS/RpostC group. Neutrophil accumulation within liver sinusoid substantially reduced in the RIPC/LPS group (E) and LPS/RpostC group (F) compared with that in the LPS group (D) at 12 h after LPS injection. The brown colored neutrophils are stained with anti-mouse Ly-6G (black arrows). Magnification × 400. (G) Quantification of intrahepatic sinusoidal neutrophils by counting PMNs in 16 random high-power fields. Magnification × 400. Mice were treated with saline (Saline group), RIPC plus saline (RIPC/Saline group), saline plus RpostC (Saline/RpostC group), LPS (20 mg/kg, i.p.; LPS group), RIPC plus LPS (RIPC/LPS group), and LPS plus RpostC (LPS/RpostC group). i.p.: intraperitoneal. RIPC: remote ischemic preconditioning, RpostC: remote ischemic postconditioning. Data are expressed as mean ± SEM (n = 6 in each group). *P < 0.05 versus LPS group. Data are † P < 0.05 versus Saline, RIPC/Saline, Saline/RpostC.
