Figure 1.

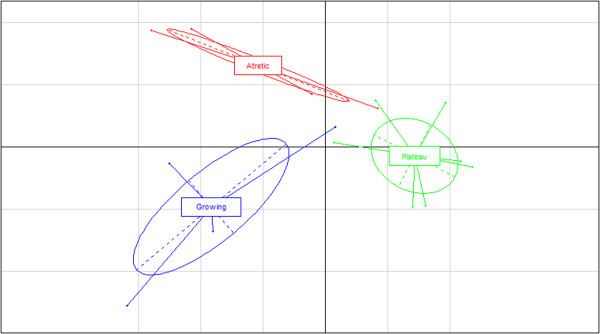
A between group analysis (BGA). The analysis was performed using R software [22] and using all probes’ data from the 3 folliculogenesis phases: Growing (Blue), Plateau (green) and Atretic (red).

A between group analysis (BGA). The analysis was performed using R software [22] and using all probes’ data from the 3 folliculogenesis phases: Growing (Blue), Plateau (green) and Atretic (red).