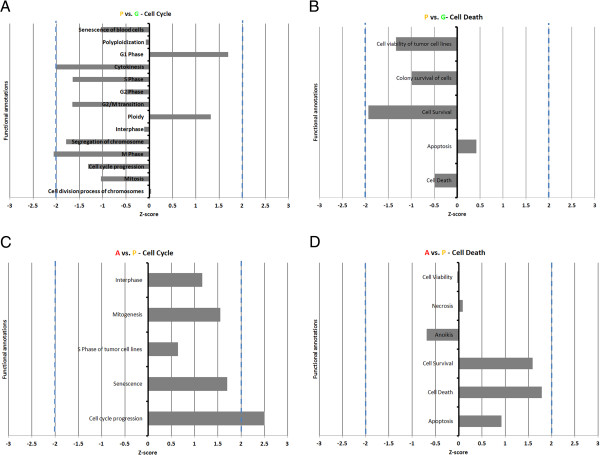
Figure 4.

Graphical representations of functional annotations. The Cell Cycle (A, C) and Cell Death (B, D) functional annotations for P (plateau phase) vs. G (growing phase) and A (atretic phase) vs. P (plateau phase) are respectively presented. Dashed blue lines indicate the z-score threshold for statistical significance (-2.00 and +2.00). All annotations were above the –log(p-value) threshold indicating statistically significant overlap between genes from the study’s dataset and genes associated to the annotation in the IPA database (-log(0.05) = 1.3).
