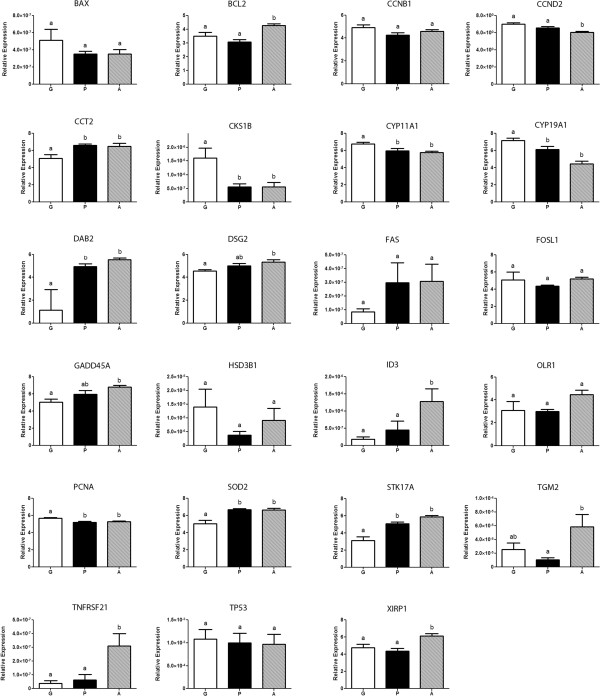
Figure 7.

Graphs of gene expression profiles. 23 genes were measured by qRT-PCR in the growing (G) (white box), plateau (P) (black box) and atretic (A) (dashed box) phases (n = 7, 6 and 7 follicles). Different letters above bars correspond to significantly different expression levels (P < 0.05). Error bars represent the standard error of the mean (SEM). BAX, BCL2-associated X protein; BCL2, B-cell CLL/lymphoma 2; CCNB1, Cyclin B1; CCND2, Cyclin D2; CCT2, Chaperonin containing TCP1, subunit 2 (beta); CKS1B, CDC28 protein kinase regulatory subunit 1B; CYP11A1, Cytochrome P450, family 11, subfamily A, polypeptide 1; CYP19A1, Cytochrome P450, family 19, subfamily A, polypeptide 1; DAB2, Disabled-2 DSG2 Desmoglein-2; FAS, Fas (TNF receptor superfamily, member 6); FOSL1, FOS-like antigen 1; GADD45A, Growth arrest and DNA-damage-inducible, alpha; HSD3B1, Hydroxy-delta-5-steroid dehydrogenase, 3 beta- and steroid delta-isomerase 1; ID3, Inhibitor of DNA binding 3, dominant negative helix-loop-helix protein; OLR1, Low density lipoprotein (lectin-like) receptor 1; PCNA, Proliferating cell nuclear antigen; SOD2, superoxide dismutase 2, mitochondrial; STK17A, serine/threonine kinase 17a; TGM2, Transglutaminase 2 (C polypeptide, protein-glutamine-gamma-glutamyltransferase); TNFRSF21, Tumor necrosis factor receptor superfamily, member 21; TP53, Tumor protein p53; XIRP1, Xin actin-binding repeat containing 1.
