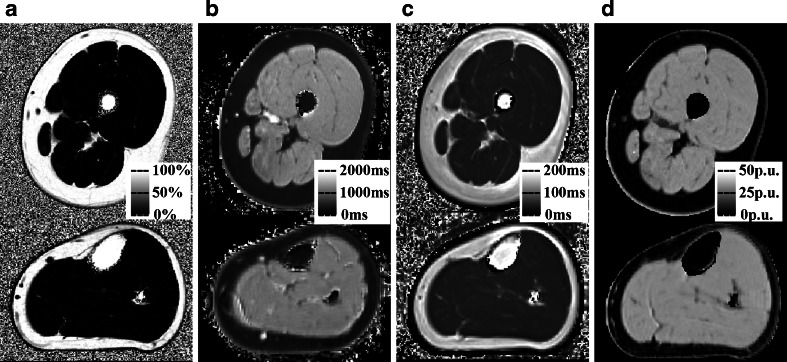
Fig. 2.
Sample quantitative maps from a single volunteer (a 24-year-old man, left thigh and calf). a Fat fraction map (in %). b T1 map in ms at left thigh and calf level. c T2 map (in ms). d MTR map (in p.u.). All images are axial with standard orientation (anterior at top of image, right hand side at left of image)

