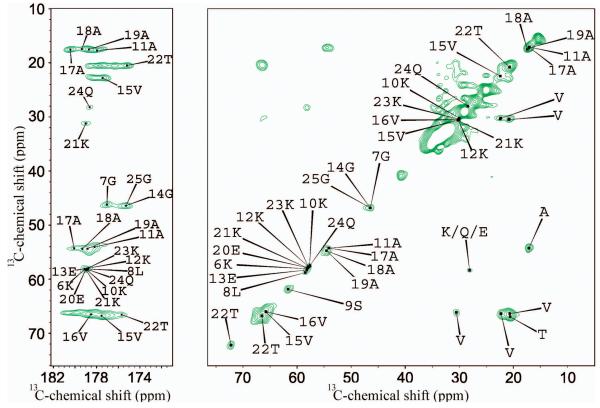
Figure 2. MAS ssNMR spectrum of αS bound to POPG SUV.
The carbonyl region (left panel) and the aliphatic region (right panel) are shown in a 13C-13C DARR correlation spectrum of a sample of αS bound to POPG SUV recorded using a contact time of 100 ms at a temperature of −19 °C at a MAS rate of 10 kHz. Residue names are reported using the single letter convention.

