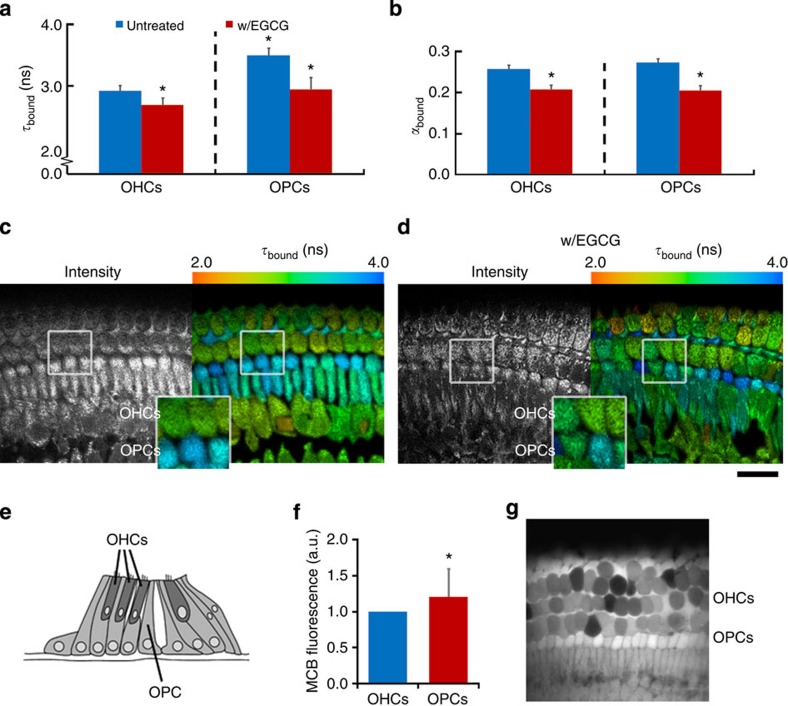
Figure 3. Supporting cells in the mammalian cochlea exhibit increased enzyme-bound NADPH.
(a) Mean τbound and (b) αbound values in outer hair cells (OHC’s) and adjacent outer pillar ‘supporting’ cells (OPC’s) under control conditions and following application of EGCG (200 μM). Error bars indicate±s.d., *P<0.05 (two-tailed Student’s t-test, n=11). (c,d) Corresponding representative FLIM images colour coded for the mean parameter value in each cell. Scale bar, 25 μm. (e) Schematic diagram showing organ of Corti in the cochlear explants, indicating the positions of OHC’s and OPC’s. (f) Mean fluorescence intensity in OPC’s and OHC’s. Error bars indicate±s.d., *P<0.05 (Wilcoxon signed-rank test, n=17). (g) Representative image following MCB staining for GSH concentration.

