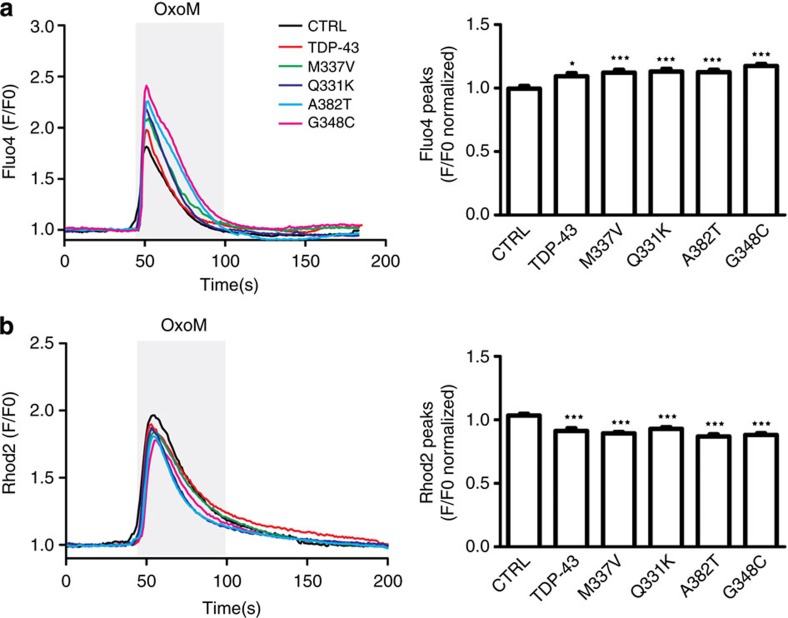
Figure 8. Expression of TDP-43 disrupts cellular Ca2+ homeostasis.
HEK293 cells were transfected with M3R and either control empty vector (CTRL), TDP-43, TDP-43M337V, TDP-43Q331K, TDP-43A382T or TDP-43G348C as indicated. Release of ER Ca2+ was induced by treatment of cells with Oxotremorine-M (OxoM). (a) shows cytosolic Ca2+ levels with representative Fluo4 fluorescence traces on the left and normalized peak values on the right. Fluo4 fluorescence shows a transient increase in cytosolic Ca2+ levels upon OxoM treatment but compared with control, wild-type and mutant TDP-43 all increase peak cytosolic Ca2+ levels. (b) shows mitochondrial Ca2+ levels with representative Rhod2 fluorescence traces on the left and normalized peak values on the right. Data were analysed by one-way analysis of variance and Tukey’s post hoc test. (a) N=48–52 cells from 3–5 experiments; (b) N=48–52 cells from 3–4 experiments. *P<0.05, ***P<0.001; error bars are s.e.m.

